
Eastern Bering Sea - 2003
S. Rodionov, P. Stabino, J. Overland, N. Bond, S. Salo
The winter of 2003 was very mild in the Bering Sea. Mean winter (DJFM) surface air temperature (SAT) in St. Paul was 2.1oC (or more than one standard deviation) above normal (Fig. 1a). This mild weather was associated with an intensified Aleutian low that pumped warm Pacific air into the eastern Bering Sea. Although an intensification of the Aleutian low is characteristic of El Niño winters, after the 1977 climate shift, the center of the depression was often positioned too far east of its normal position near the dateline, causing an advection of cold air from Alaska into the Bering Sea. This years reaction of winter temperature to an El Niño event is more typical for the pre-1977 period.
The recent decades saw an increase in the interannual variability of winter temperatures in the Bering Sea, as opposed to more persistent cold and warm states before and after the regime shift respectively (Fig. 1a). The magnitude of positive SAT anomalies, however, still remains higher than the negative ones. Another emerging pattern in temperature variability is that winters tend to start on the cold side, and these early negative temperature anomalies can cause significant ice cover, as illustrated by the Ice Cover Index (Fig. 1b). However, due to strong positive SAT anomalies during late winter, spring and summer, mean annual temperature anomalies remain positive. Some cases in point are 1998, 2000, and 2002.
This pattern appears to be associated with a shift in the peak of cyclonic activity in the Bering Sea. Normally, the maximum storm activity is observed in November as the storm track moves south through the Bering Sea in its annual cycle. In winter, the storm track is located south of the Aleutian Islands. During 1998, 2000, and 2002, unusual cyclonic activity developed in the Bering Sea either in February or March; the temperature increased substantially and the ice retreated.
All this leads to an increased variability in the timing of maximum ice cover, which itself have little relation with the total area or extent of ice cover. Typically, the heavier the ice cover in a given winter the later it retreats in the spring, but, as Fig. 2 illustrates this was not the case in recent years. Particularly striking was the winter of 2000, when ice cover had its maximum in January, reaching farther south then in any other winter during 1997-2002, but then quickly retreated in February.
Atmospheric circulation during spring and early summer is characterized by a tendency toward positive sea level pressure anomalies. This suggests lighter winds, less cloud cover, more insolation, and hence, faster warming of the sea. As a result, the transition from winter to spring occurs earlier and faster.
Sea ice plays an important role in determining the timing of the spring phytoplankton bloom. If there is ice after mid-March there is an associated ice-edge phytoplankton bloom. If there is no ice after that date, then the spring phytoplankton bloom occurs later in May or even June when the water column becomes thermally stratified. The timing of the spring bloom is critical to supplying food to zooplankton. A phytoplankton bloom during March or April when the water is cold favors the benthic community since the zooplankton is unable to fully consume it. Alternately, a bloom in May is cropped by zooplankton ultimately favoring the pelagic fishery.
 Fig. 1. a) Mean winter (DJFM) surface air temperature anomalies in St. Paul, Pribilofs Islands, 1970-2003, b) Ice Cover Index, 1970-2002, c) number of weeks with ice cover after March 15 in the area 56-58 oN, 163-165oW, 1972-2003, and c) Surface temperature anomalies (Jan-Apr) at Mooring 2 (NCEP/NCAR Reanalysis data), 1970-2002.
There is an obvious negative trend in the timing of ice retreat calculated for the 2o x 2o rectangle (area 56-58oN, 163-165oW) that includes Mooring 2 (Fig. 1c). During the 3-year period of 2000-2002, no ice was observed in this area after mid-March. Over the record extending back to 1972, there had not been even two years in a row lacking ice at Mooring 2, prior to 2000. Interestingly, in 2003 ice first showed up in this area only in mid-March during a period of brief cooling; this ice remained for two weeks.
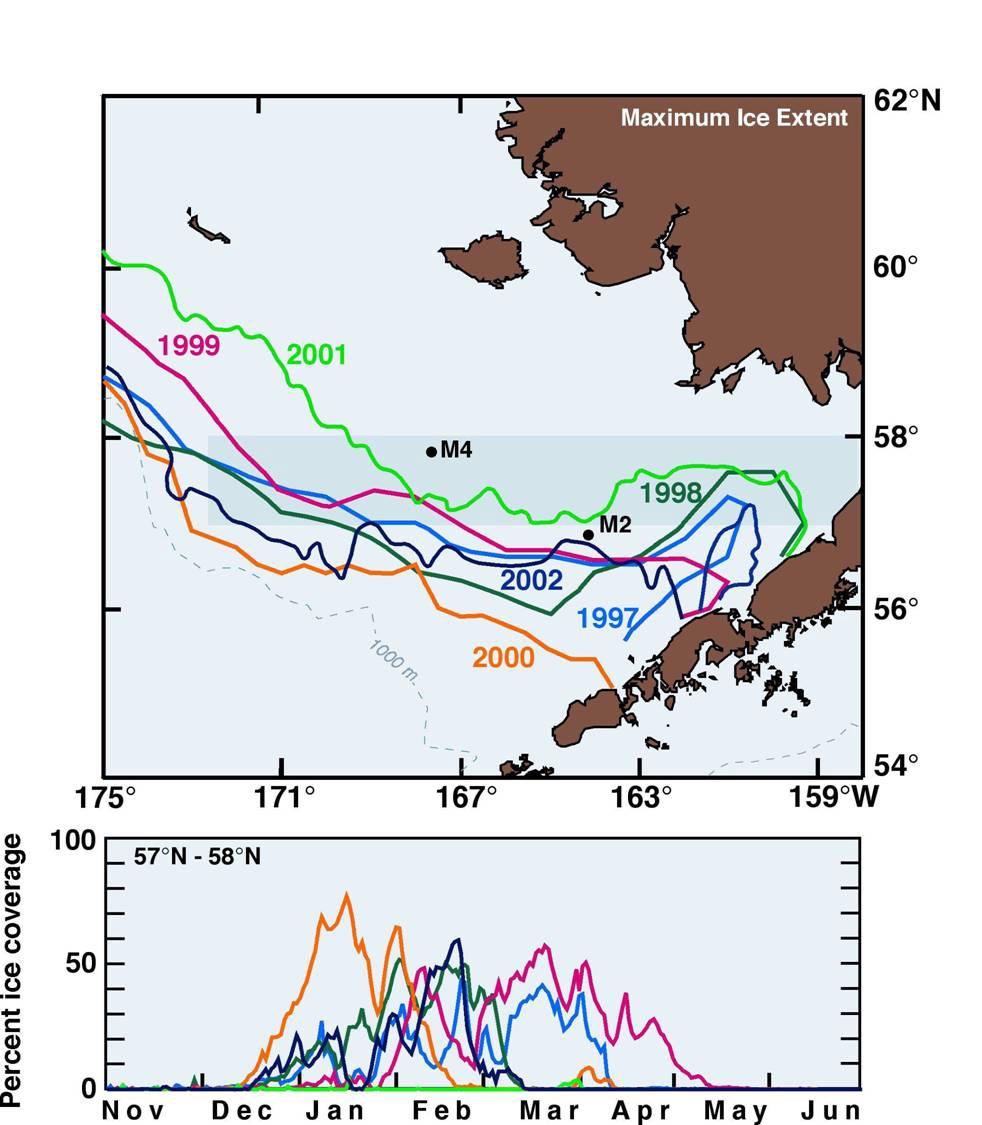 Fig. 2. Top: Maximum ice extent during the period 1997-2002. Bottom: Weekly percent ice cover of the area indicated by the shaded box in the top figure (57oN 58oN) for the same 6-year period.
Fig. 1c illustrates historical changes in the mean January through March ocean surface temperatures at Mooring 2 from the NCEP/NCAR Reanalysis data and Fig. 3 shows observed temperature at this location for each year since 1995. Note unseasonably high temperatures during the first 1-2 months of the last three years (2001-2003), with no presence of ice. In addition, winds during 2003 were very weak, resulting in a two layer thermal structure in February. It has been hypothesized that warmer temperatures over the shelf would result in northward shift of shelf ecosystems. Since most of the variability on the Bering Sea is interannual, it can be difficult to pick out trends in climate patterns. These data from the mooring site, however, indicate that a warming is liable to be occurring on the shelf. Whether this is short term or even decadal in nature is unknown, but changes in temperature on the shelf would likely impact its ecosystems.
For more information on the Bering Sea climate and recent trends in the atmospheric and oceanic indices visit www.BeringClimate.noaa.gov. The data section of this web site currently contains 44 indices broken into five categories: climate indices, atmosphere, ocean, fishery, and biology. The metadata for each index describes: 1) the source where it was obtained, or the raw data used for its calculation, 2) its relevance to the ecosystem, and 3) recent trends in its fluctuations. There are also the capabilities to draw single or stacked plots, calculate correlation coefficients, and download the data.
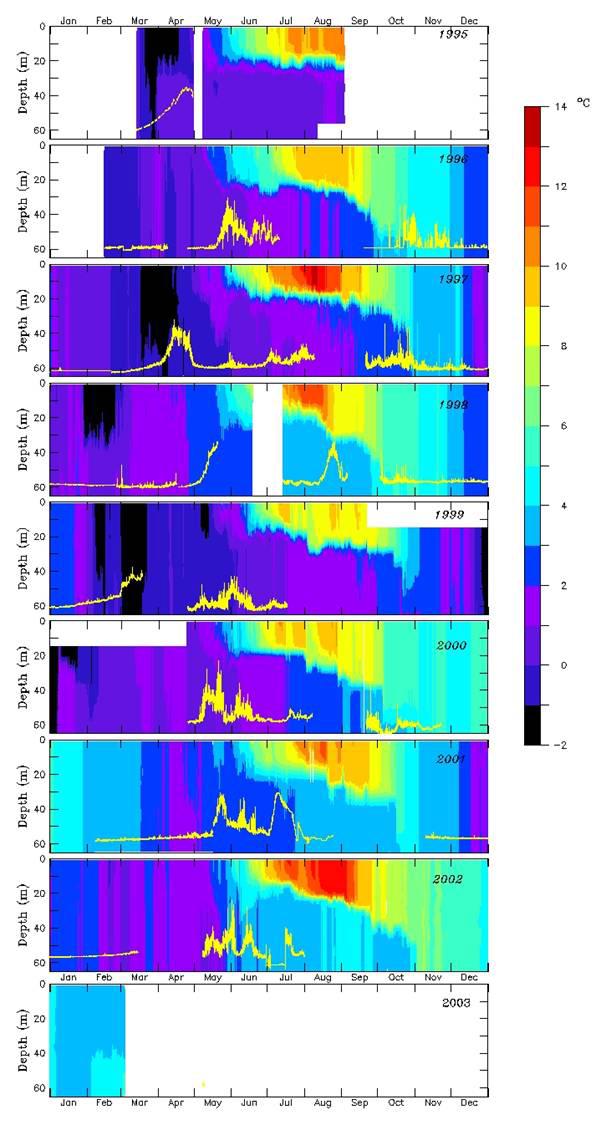 Fig. 3. Time series of ocean temperatures and fluorescence from Mooring 2. The thin yellow line in each panel is fluorescence at 11m. Temperatures of less than -1°C indicate the presence of ice over the mooring. Note that during 1996, ice was present during the winter when there was no mooring in the water at this site.