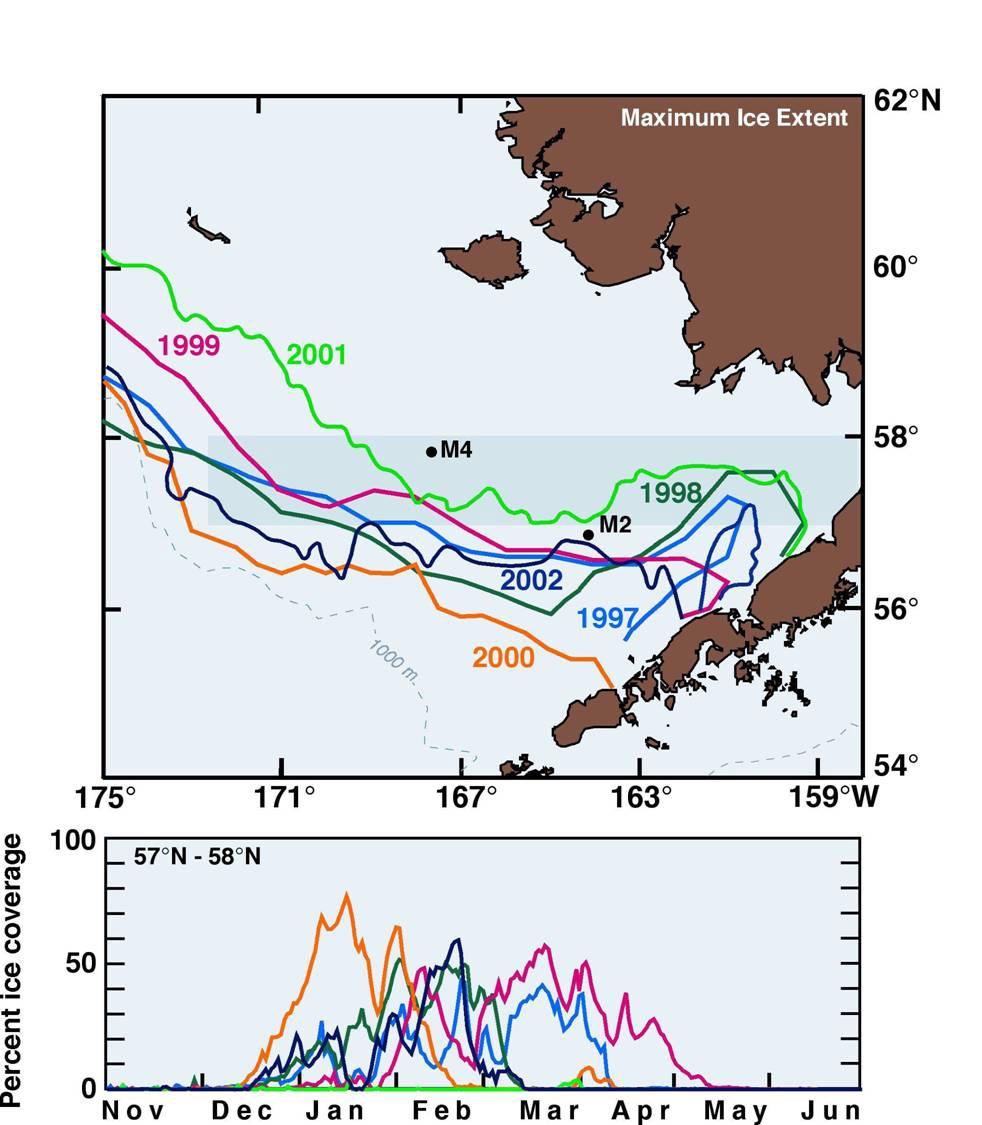
Figure 2. Top: Maximum ice extent during the period 1997-2002. Bottom: Weekly percent ice cover of the area indicated by the shaded box in the top figure (57° N 58°N) for the same 6-year period.