
Climate Overview - 2003
S. Rodionov, J. Overland, and N. Bond
The winter of 2003 was impacted by an El Niño event in the equatorial Pacific (Fig. 1). This event was most pronounced in the central part of the equatorial zone (Nino 3.4 region in Fig. 2), whereas near the coast of South America (Nino 1+2 region) it was barely noticeable in terms of sea-surface temperature (SST) anomalies in this region. During the spring of 2003 negative SST anomalies developed in this region in this region, but at the time of this report (July 2003) the equatorial Pacific is in near-neutral state.
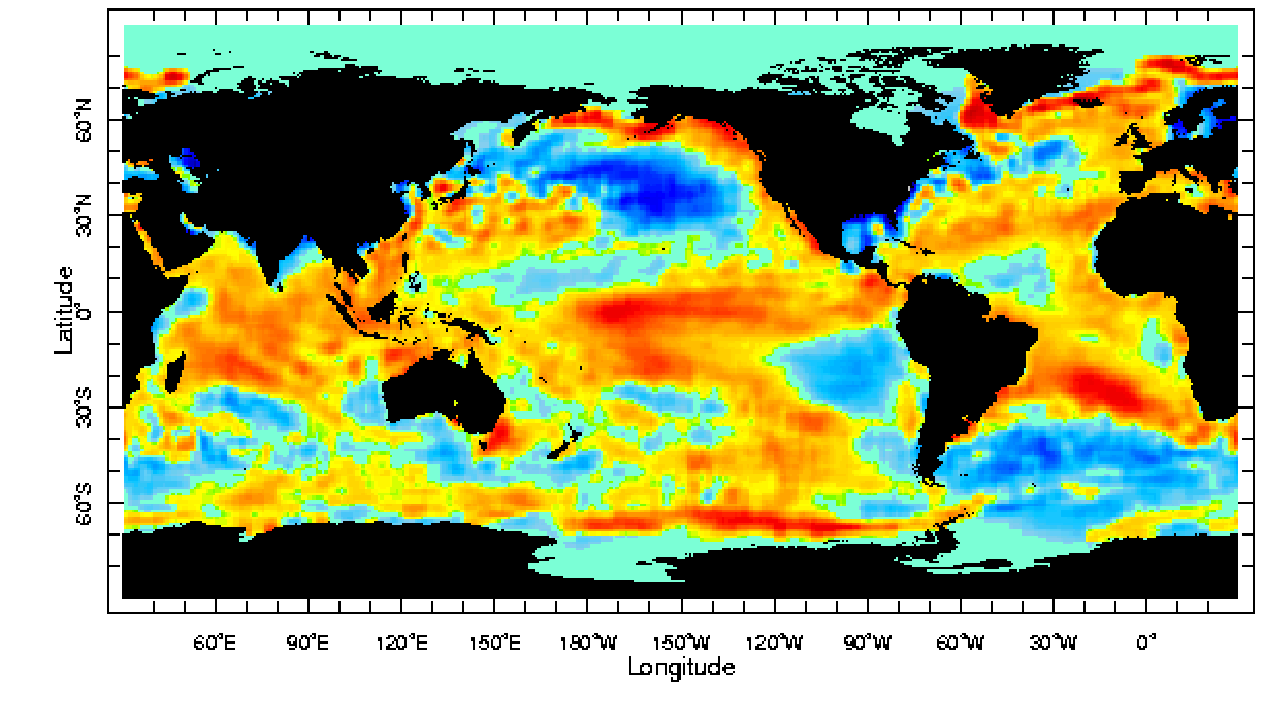 Fig. 1. SST anomalies in January 2003.
The distribution of SST anomalies in the North Pacific during the winter of 2003 was typical for an El Niño event, with a strip of anomalously warm water along the west coast of North America extending from the equator to the Gulf of Alaska and farther into the Bering Sea (Fig. 1). The central part of the North Pacific was occupied by an extensive pool of anomalously cold waters. Overall, the distribution of SST anomalies resembled the positive Pacific Decadal Oscillation (PDO) pattern, which is reflected in strongly positive values of the PDO index (Fig. 3). The mean winter (DJF) value of the PDO index during this winter was the second highest (after 1941) for this season since the record began in 1901. The spring (MAM) value of the PDO index was also strongly positive exceeding the mean value for the post-1977 regime (1978-2003).
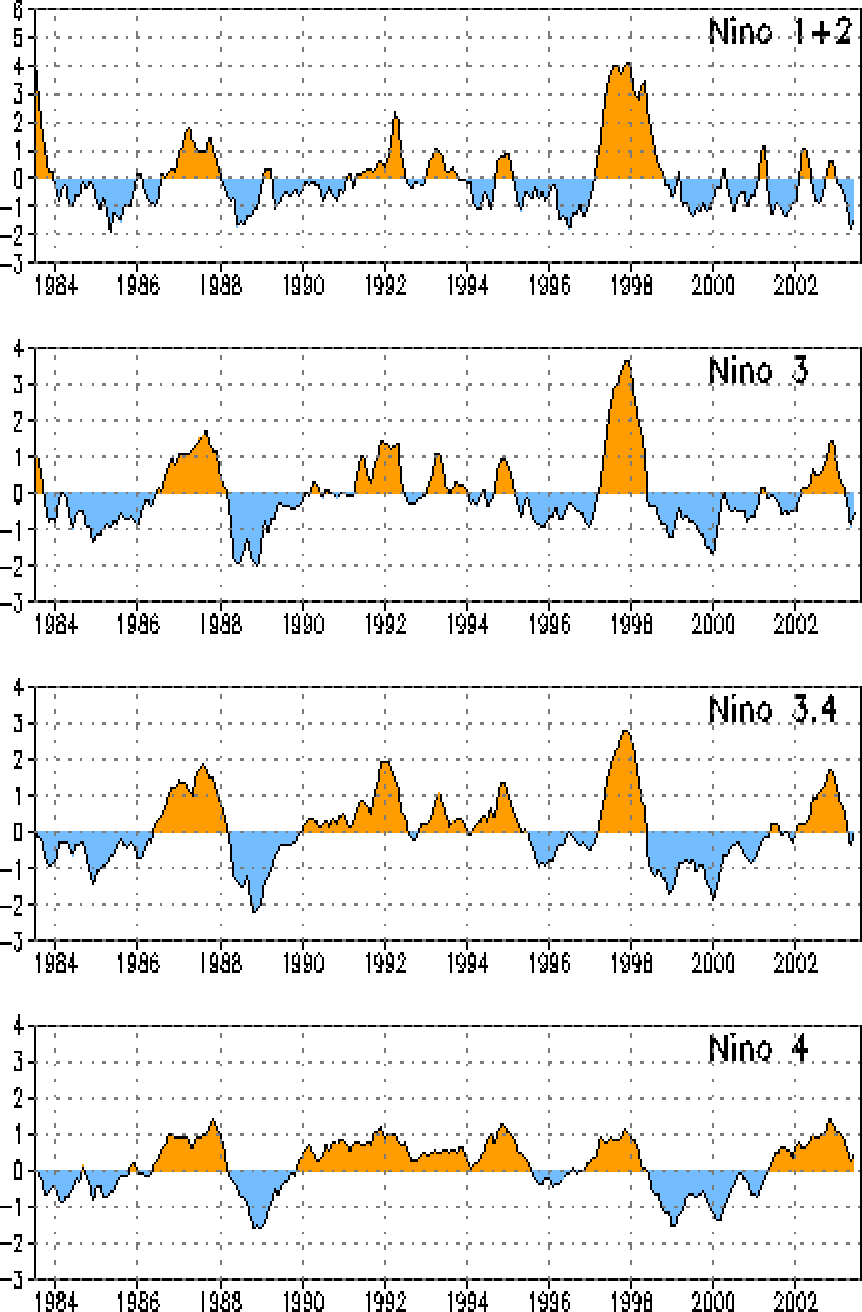 Fig. 2. SST anomalies (deg. C) along the west coast of South America (Nino 1+2 region) and central parts of the equatorial belt (Nino 3 and 3.4 regions).
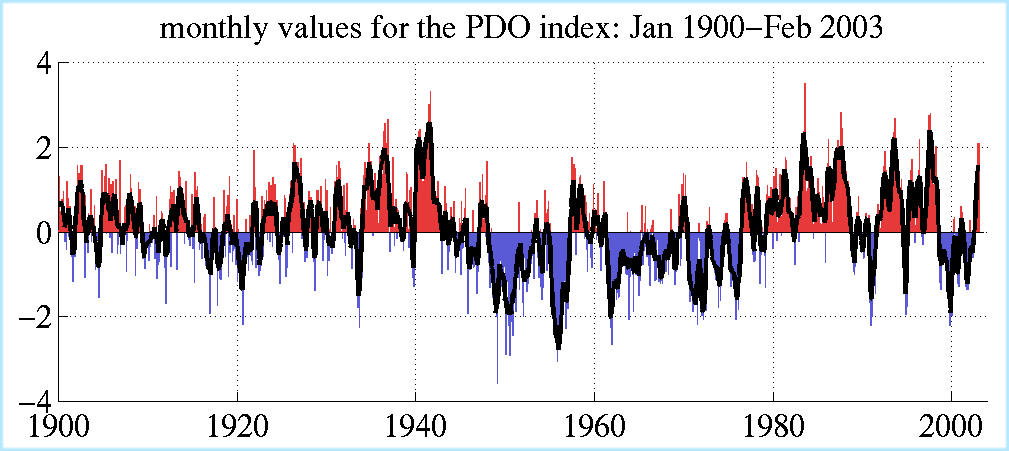 Fig. 3. Monthly values of the PDO index, January 1900 February 2003 (Mantua et al. 1997).
The atmospheric circulation during the winter of 2003 was characterized by a deep Aleutian low centered south of the Alaska Peninsula. This is typical for both El Niño and positive PDO winters. The North Pacific Index (NPI), which measures sea level pressure (SLP) over the region 300N-650N, 1600E-1400W was strongly negative (Fig. 4). Note that, unlike the PDO index (Fig. 3), the NPI shows no sign of reversal around 1999. But was there really a reversal in the PDO spatial pattern?
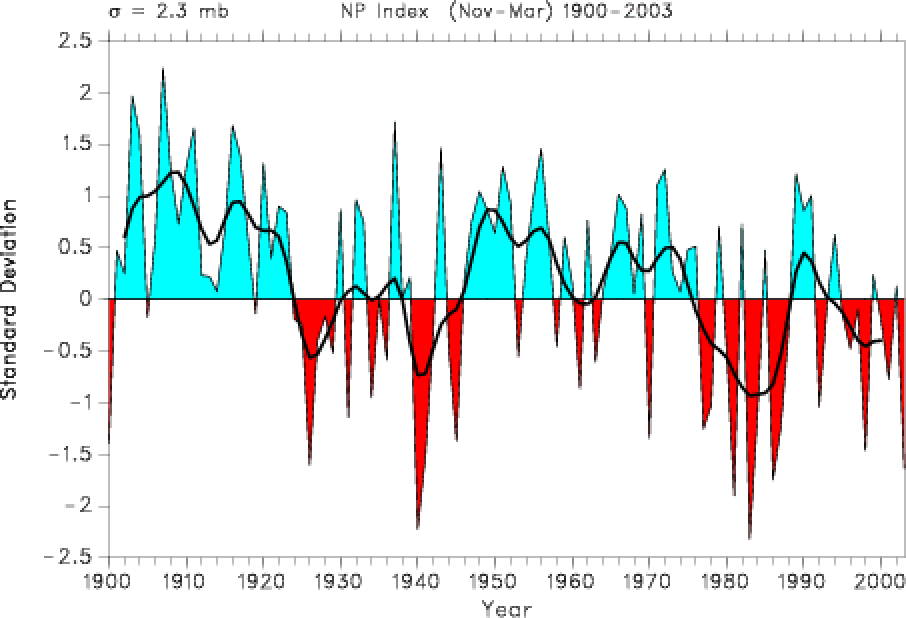 Fig. 4. The North Pacific Index, 1900-2003 (Trenberth and Hurrell, 1994).
Fig. 5 shows the distribution of mean winter SLP (left column) and SST (right column) for two 5-yr periods, 1972-1976 (top panel) and 1999-2003 (bottom panel). The first set is typical for a negative PDO phase; it features an anomalously high pressure cell over the east-central north Pacific and the Bering Sea (Fig. 5a). The corresponding SST pattern (Fig. 5b) consists of a pull of warm water in the east-central Pacific and cold water along the west coast of North America.
In contrast, the distribution of SLP during 1999-2003 represents a dipole, with the positive center over the eastern subtropical Pacific and the negative center over the Bering Sea and eastern Alaska. The latter center is a reflection of an enhanced cyclonic activity in the higher latitudes (particularly since February 2000) that resulted in an advection of warm Pacific air into the eastern Bering Sea and cold Siberian air into the Sea of Okhotsk. These are the two areas where the difference in SST between 1999-2003 and 1972-1976 are particularly striking.
The SLP pattern in Fig. 5c resembles the so-called North Pacific Oscillation (NPO). In the early 1930s this pattern was discovered by Sir Gilbert Walker who first noticed an opposition between SLP variations over Hawaii and Alaska. Apparently, climate variations other than strictly associated with the PDO characterize the recent state of the North Pacific.
![]()
![]() Fig. 5. SLP and SST anomalies for the winters of 1972-76 and 1999-2003.
Fig. 5. SLP and SST anomalies for the winters of 1972-76 and 1999-2003.
One of the major modes of atmospheric circulation not related to the PDO is the Arctic Oscillation (AO). The AO experienced an abrupt shift in 1989 (Fig. 6) and was among the best candidates for explaining a concurrent shift in some biological indices. Since then, however, the magnitude of the AO index slowly decreased to near-normal values, and it is unlikely that this mode played an important role in recent climatic fluctuations in the Pacific sector.
A major question about the state of the Pacific climate is whether or not it experienced a shift toward a new climatic region around 1999. The negative phase of the PDO during 1999-2001 coincided with a prolonged La Niña event, whereas the switch back to the positive PDO phase in 2003 was accompanied by an El Niño event. Therefore, it all may be just short-term climatic fluctuations rather than a shift to a new multi-decadal regime. An analysis of various climatic indices sends a mixed signal. While some of them (e.g., the Pacific-North American index, Aleutian low pressure index, and zonal wind index) show no sign of reversal, other indices point to important changes since 1999. Among the latter are the winter West Pacific index, spring-to-summer East Pacific and North Pacific indices, and summer PDO (data until 2002) index.
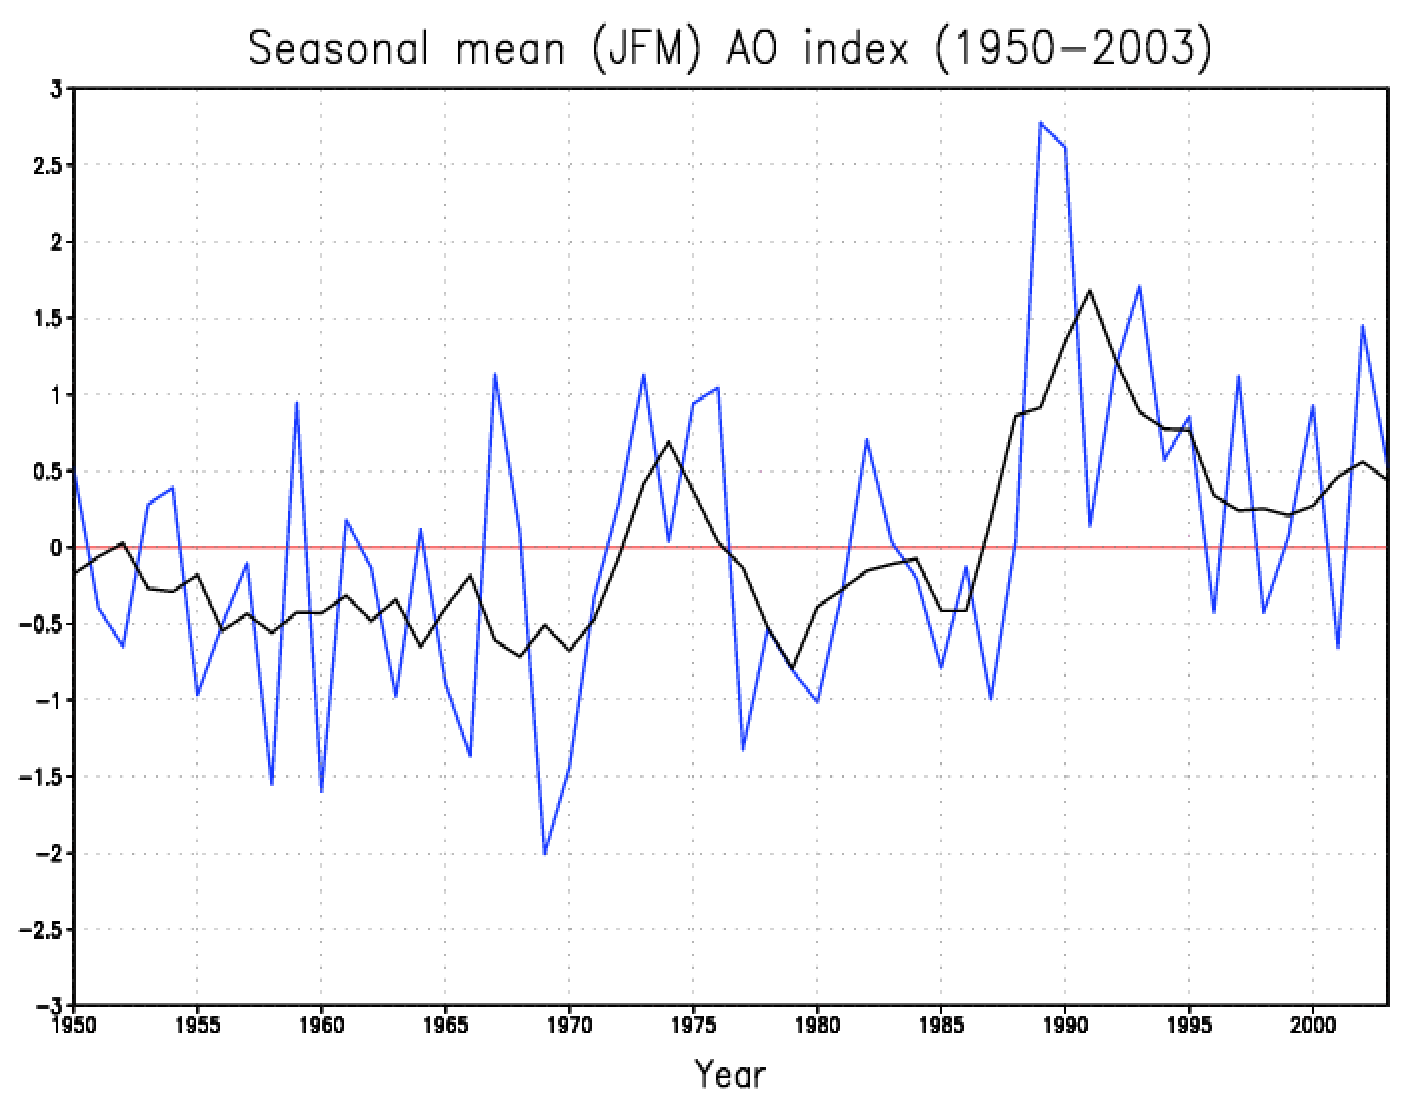 Fig. 6. Mean winter (JFM) Arctic Oscillation index (blue line), 1950-2003. The black line denotes a five-year running mean of the index. The index is normalized using 1950-2000 base period statistics.
In summary, climatic events during the winter and spring of 2003 significantly reduced our confidence in a regime shift in the North Pacific climate. The winter of 2003 resembled in many respects those winters that were observed during the first part of the post-1977 regime. Nevertheless, the last 5-year period, 1999-2003, as a whole, showed significant deviations from a typical positive PDO pattern. Those deviations, however, do not indicate a return to the pre-1977 climate.