Recent Shifts in the State of the North Pacific Climate System
Dr. Nicholas A. Bond
NOAA/PMEL - University of Washington/JISAO
Sockeye salmon returns in Bristol Bay of the Bering Sea began to take a sudden turn for the worse in 1997 after about two decades of very good to record-setting runs (See Figure 1 at right). About a year later, the biological productivity increased markedly along the U.S. west coast, again after a prolonged period of low productivity; the salmon stocks of the Pacific coast have responded positively. Previous research has shown that salmon runs in Alaska tend to be out of phase with those in the lower 48 on decadal time scales, and that these fluctuations are linked to climate cycles. In particular, a phenomenon known as the Pacific Decadal Oscillation or PDO (Mantua et al. 1997) has been shown to be associated in dramatic shifts in the climate of the North Pacific around 1949 and 1976, with accompanying re-organizations of the marine ecosystem. Are the recent changes in the physical and biological properties of the North Pacific a sign that the PDO has shifted once again? This and related questions are being addressed by a diverse group of meteorologists, oceanographers, chemists and biologists.
Changes in the Last Decade
It is instructive to compare the recent changes in the North Pacific to those characteristic of the PDO. The last major shift in the PDO occurred in 1976-77 and marked a change from cold to warm conditions in Alaskan waters. This brought about a host of effects on the marine ecosystem, notably growth in populations of pelagic species such as walleye pollock and salmon, and decline in populations of benthic species such as king crab and shrimp. So how have these populations fared in recent years? The available evidence suggests a mixed bag: for example, salmon runs have generally been moderate in Bristol Bay and very good in the Gulf of Alaska, and to a certain extent, shrimp are coming back in the Gulf of Alaska. In other words, the fish are telling us that the PDO is not the entire story.
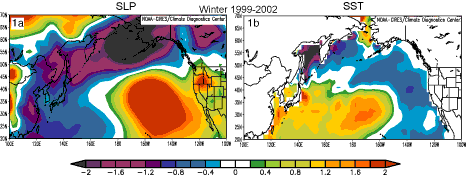
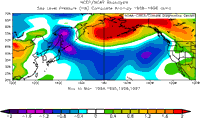
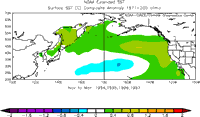
Anomaly maps are used here to illustrate the state of the North Pacific, relative to its long-term mean. Two fundamental elements of the atmosphere-ocean system are sea level pressure (SLP) and sea surface temperature (SST). The signals in SLP and SST tend to be strongest in winter. The SLP and SST anomaly maps for the the winters of 1999-2002 (labeled for the year corresponding to January) are shown above in Figure 2. The SLP map features a prominent dipole with anomalously low pressure in the Bering Sea and anomalously high pressure north of Hawaii. The corresponding SST map includes a broad band of positive anomalies extending eastward from China, a band of negative anomalies curving from off the west coast of the U.S. to north of Japan, and a small region of abnormally warm temperatures in the northern Bering Sea. The relatively cool SSTs in the central North Pacific are associated with enhanced westerly winds which cause more mixing to the surface of cold water at depth; the cool water off the west coast is associated with enhanced upwelling and transports of cooler water, both due to wind anomalies from the northwest. The relative warmth in the Bering Sea can be attributed to the abnormally low SLP, and hence more storms than usual with their maritime air masses. The period of 1999-2002 followed on the heels of the intense El Niño of 1998, which can be thought of as a singular event capable of resetting the North Pacific climate system. It is therefore interesting to see how conditions changed between before and after this breakpoint. Note that the SLP and SST anomaly maps for the winters of 1994-97 (Figures 3 and 4, to the left) are roughly opposite to their counterparts for the winters of 1999-2002, especially east of the dateline. In particular, the earlier period also has a dipole pattern in SLP, but of a reversed sense. It bears emphasizing that the changes in the North Pacific climate system that occurred in the late 1990s are significantly different than those associated with the PDO itself.
The swings in the PDO are associated with changes in the sign of a monopole in anomalous SLP, rather than the dipole in SLP dominating the last decade. In addition, the pattern of anomalous SST with the PDO is shifted to the southwest of those shown above for the anomaly maps for the 1990s. In mathematical terms, a mode or component of the variability that has been the second-most important over the historical record (the PDO is first) happens to have dominated in the 1990s. More detail on this matter is provided by Bond et al. (2003). Effectively, conditions during 1999-2002 off the west coast resembled those during previous periods when the PDO was negative, and conditions in the northern portion of the Pacific resembled those during PDO-positive periods. From this perspective, it is no surprise that salmon have generally prospered in both regions.
Understanding the North Pacific Climate System
There are some tentative indications that Arctic is playing a role, if not controlling, the recent changes in the North Pacific. The shift in the second mode in the North Pacific in the late 1990s coincided with a transition in the Arctic Oscillation (AO) from a systematically positive state to a more or less neutral state. The AO projects onto sea level pressure in the vicinity of the Aleutian Islands, and hence helps account for the lower pressures in that region during the winters of 1999-2002, relative to those earlier in the 1990s. Perhaps the most important point here is that the Bering Sea constitutes a sort of crossroads between the mid-latitude North Pacific and the Arctic Ocean and is therefore subject to changes inherent to the climate systems of both regions.
An important lesson has emerged that the PDO, in and of itself, is incomplete for characterizing the North Pacific climate system. Current research is being carried out to better determine the nature of the coupling between the atmosphere and ocean in the North Pacific, and the degree to which this system may be predictable. At least at the present time, we do not have the capability of anticipating changes in the North Pacific on time scales of years to decades. In addition, increasing attention is being paid to how changes in the physical system impact the marine ecosystem. Here the work is going beyond statistical relationships to examining linkages from mechanistic points of view.
References:
Bond, N.A., J.E. Overland, M. Spillane, and P.J. Stabeno (2003): Recent shifts in the state of the North Pacific. Geophys. Res. Lett., 30 (23), 2183, doi: 10.1029/2003GL018597.
Mantua, N., S. Hare, Y. Zhang, J. Wallace, and R. Francis, A Pacific interdecadal climate oscillation with impacts on salmon production, Bull. Am. Meteorol. Soc., 78, 1069–1079, 1997.
Additional Information:


