
Climate Overview - 2004
S. Rodionov, J. Overland, and N. Bond
The first part of this report is focused on decadal-scale variability after the major climate shift in the late 1970s, and the second part describes the climate conditions in 2004. It is shown that in the past three decades the North Pacific climate system) experienced two minor regime shifts. The first of these shifts occurred in 1989, primarily in the winter Pacific Decadal Oscillation (PDO) index, which represents the leading mode of North Pacific sea surface temperature (SST) variability and is related to the strength of the Aleutian low. The second shift was in 1998, and was associated with a change in the sign of the second principal mode of North Pacific SST variability, the so-called Victoria pattern, in winter and the PDO index in summer. The atmospheric expression of the Victoria pattern is a north-south pressure dipole, with the negative 500-hPa height anomaly center over the eastern Aleutian Islands and the positive center over the east-central North Pacific (positive mode of the pattern). During the period 1989-1997, atmospheric pressure tended to be above normal in the high latitudes and below normal in the mid-latitudes, which translated to a relative cooling in the Bering Sea. Since 1998, the polarity of the winter north-south pressure dipole reversed. The SST field responded in the way that the eastern Bering Sea became anomalously warm, whereas colder-than-normal conditions established along the U.S. West Coast. During the summer season, the 1998 shift exhibited itself in a transition from the north-south pressure dipole to a monopole characteristic of the negative PDO pattern. It is unclear whether this shift in the summer PDO index to significantly negative values from 1999 through 2001 represents just a temporary reprieve from positive PDO conditions, or heralds the onset of an extended period featuring negative PDO conditions throughout the year.
Recent Regime Shifts on the Decadal Time Scale
The climate shift that occurred in the late 1970s was associated with an abrupt transition from a negative to a positive phase of the Pacific Decadal Oscillation (PDO). The PDO index tracks major, multidecadal changes in the North Pacific climate, often referred to as regimes (Mantua et al. 1997). In addition to these multidecadal regimes, the climate experiences minor, decadal-scale regimes. Minobe (1999) discusses a possible resonance between the regimes on these two time scales, which may lead to an amplification of the magnitude of a shift as in the mid-1940s and late 1970s.
A question critically important for fisheries is whether a string of negative values of the PDO index in the late 1990s and early 2000s signifies the end of the positive PDO regime established in the late 1970, or it was just a temporary deviation from that regime, possibly associated with the prolonged La Niña event of 1998-2001. If this is a climate regime shift, is it on the decadal or longer time scale? It is also possible that recent changes in the North Pacific climate has little to do with the PDO, which is the first principal mode of sea surface temperature (SST) variability, but rather with the Victoria pattern, which is its second principal mode (Overland et al. 2004).
A regime shift analysis of the mean winter (DJF) PDO time series using the STARS method (Rodionov 2004) reveals only two regime shifts that are significant at the 0.01 level, one in 1943 and the other one in 1977. At the 0.05 level, however, the shift in 1989 is also detected (Fig. 1). The magnitude of the 1989 shift was not as large as the one in 1977. Nevertheless, it survived the test, despite a series of positive PDO values in the mid-1990s. Having analyzed 100 physical and biological time series, Hare and Mantua (2000) came to conclusion that the regime shift of 1989 was not as persuasive as the 1977 shift; it was more prominent in biological records than in indices of Pacific climate (McFarlane 2000). In 2003, the winter PDO index was the highest since 1941. This suggests a possibility of a new regime shift; however, it may be just a reaction to the El Niño event of 2002-2003. The shift of 1989 and a possible shift in 2003 can also be seen in the North Pacific (NP) index (Trenberth and Harrell 1994), albeit at the less strict significance level (0.2) due to strong interannual variability in the index (Fig. 1d).
 |
Fig. 1. a) Mean winter (DJF) PDO index, 1901-2004, b) mean summer (JJA) PDO index, 1900-2004, c) Annual (Jan-Dec) PDO index, 1900-2003, and d) North Pacific index (Nov-Mar) from the National Center for Atmospheric Research (Trenberth and Hurrell 1994), 1900-2004. The stepwise functions (orange lines) characterize regime shifts in the level of fluctuations of the indices. Shift points were calculated using the STARS method (Rodionov 2004), with the cutoff length of 10 years and significance levels of 0.05 for the PDO indices and 0.2 for the NPINCAR index. |
The pattern of temporal variability for the summer (Fig. 1b) and annual (Fig. 1c) PDO indices is different from that for the winter PDO index. The negative index values in the late 1980s and early 1990s were not large enough to qualify for a regime shift. Instead, a regime shift was detected in the late 1990s. During the past 7 years (1998-2004), the values of the summer PDO index were lower than the average value of the index for the regime of 1979-1997.
The shifts of 1989 and 1998 can be found in other climatic indices as well. One of the most noticeable manifestations of the 1989 shift was an abrupt transition from a negative phase of the Arctic Oscillation (AO) index to its positive phase (Fig. 2a). When the AO index is in its positive phase, it usually translates into positive sea level pressure (SLP) anomalies over the North Pacific and the Bering Sea. In fact, the mean winter Bering Sea pressure index (see the Bering Sea section of this report) shows a marked increase in SLP during the period 1989-1997. At the same time, the 1990s were characterized by frequent El Niño events and an elevated SST background in the equatorial Pacific. The period 1990-1995 has been considered as one continuous El Niño event (Trenberth and Hoar 1995), which was soon followed by the extremely strong El Niño event of 1997-1998. During El Niño events, the Aleutian low typically is stronger (deeper) than normal and is displaced south-east of its normal position (Niebauer 1998). The result of this combined effect of the AO and ENSO was a north-south pressure dipole over the eastern North Pacific, both in SLP (not shown) and 500-hPa height anomalies (Fig. 3a). This dipole is the atmospheric expression of what Overland et al. (2004) call the Victoria pattern. The oceanic part of the pattern is the second principal mode of SST variability in the North Pacific that will be described below.
 |
Fig. 2. a) Mean winter (DJF) Arctic Oscillation index, 1951-2004, b) mean winter (DJFM) East Pacific index, 1951-2004, c) Mean spring-summer (AMJJ) East Pacific index, 1950-2004, and d) mean spring-summer (AMJJ) North Pacific index from the Climate Prediction Center, 1950-2003. The stepwise functions (orange lines) characterize regime shifts in the level of fluctuations of the indices. Shift points were calculated using the STARS method (Rodionov 2004), with the cutoff length of 10 years and significance levels of 0.1 for the NPICPC index and 0.05 for other indices. |
a) 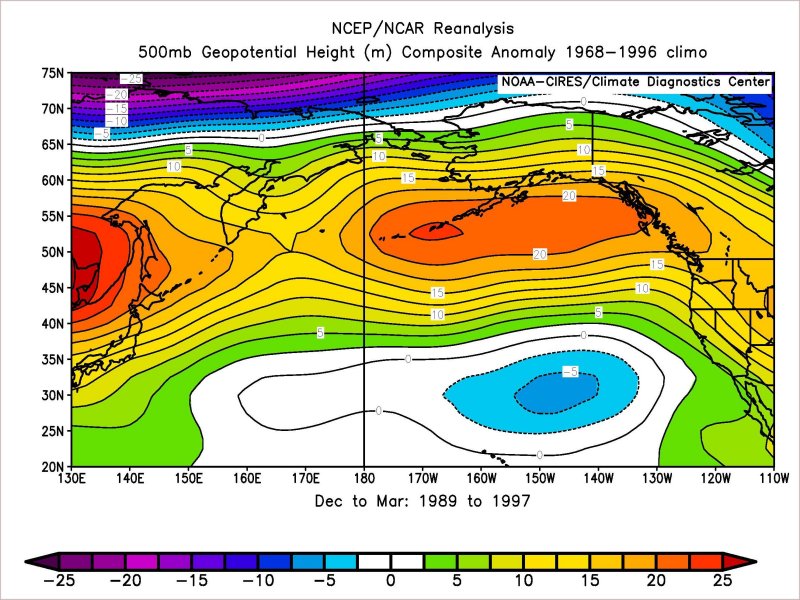 b)
b) 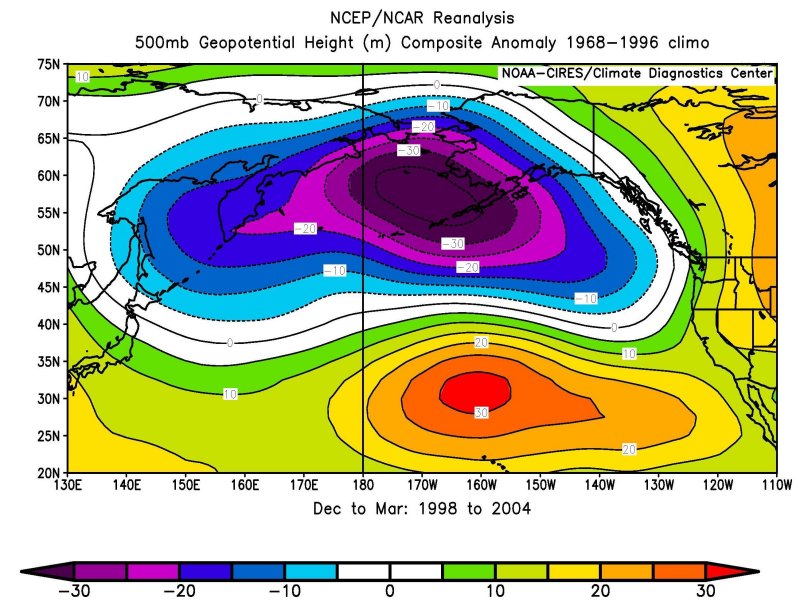 c)
c) 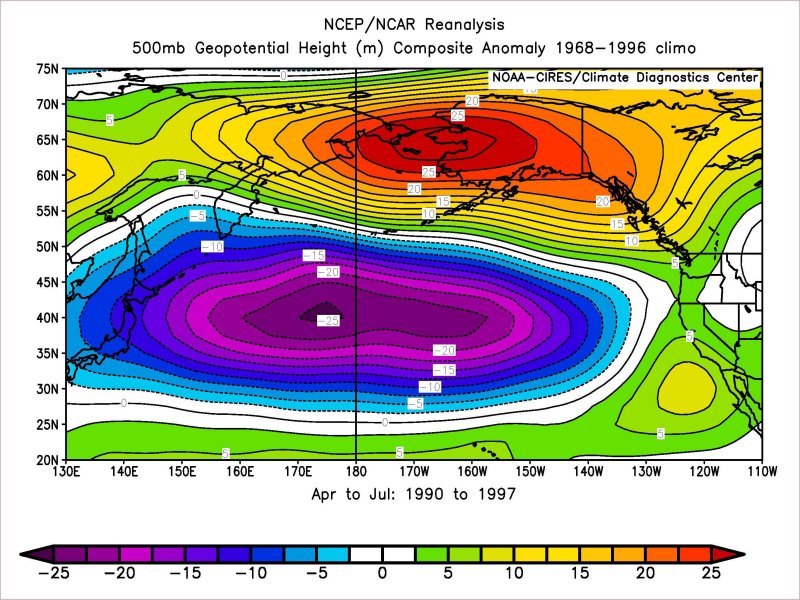 d)
d) 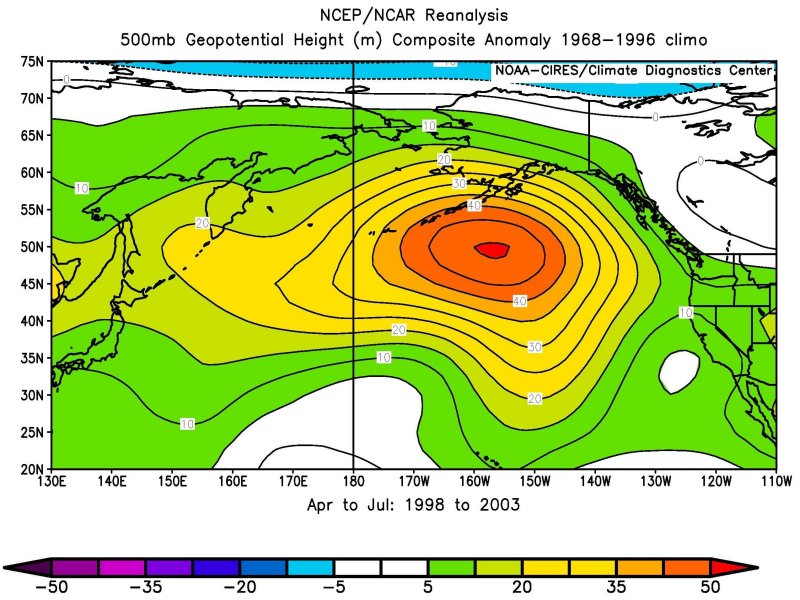
Fig. 3. 500-hPa height composite anomalies in winter (DJFM) of a) 1989-1997 and b) 1998-2004 and spring-summer (AMJJ) of c) 1990-1997 and d) 1998-2004. The base period for calculating anomalies is 1968-1996.
The Victoria pattern is related to a teleconnection mode previously identified by correlation and principal component analyses, the East Pacific (EP) pattern. The EP pattern is a north-south dipole which in its positive phase has a negative 500-hPa height anomaly center in the Gulf of Alaska and a positive center in the east-central North Pacific. During the period 1990-1997, the EP index was persistently negative (Fig. 2b). The distribution of correlation coefficients between the EP index and SSTs (Fig. 4a) clearly resembles the second principal mode of the North Pacific SST variability described by Bond et al. (2003). Unlike the PDO pattern (Fig. 4b), for which SST anomalies have the same sign along the entire west coast of North America, the second SST mode features anomalies of one sign along the U.S. West Coast and of opposite sign in the Gulf of Alaska and eastern Bering Sea. For the latter region, the 1990s were a relatively cold period.
a) 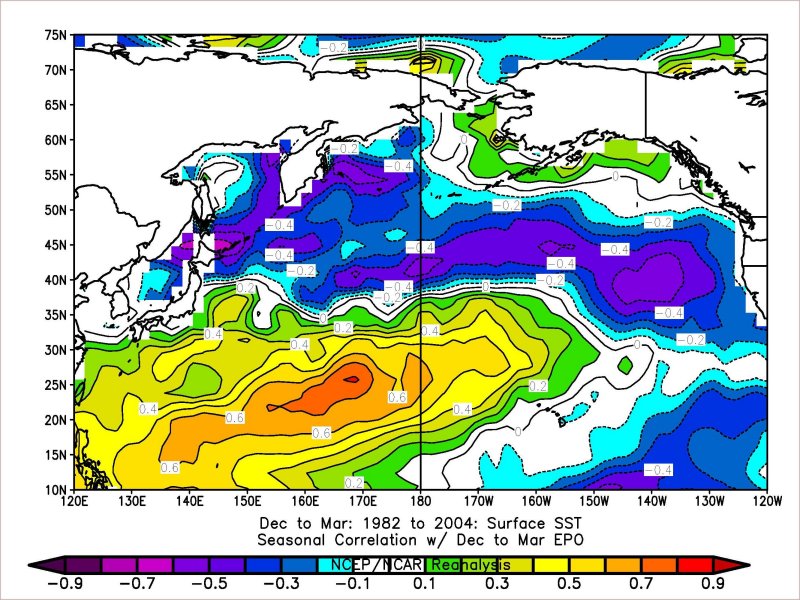 b)
b) 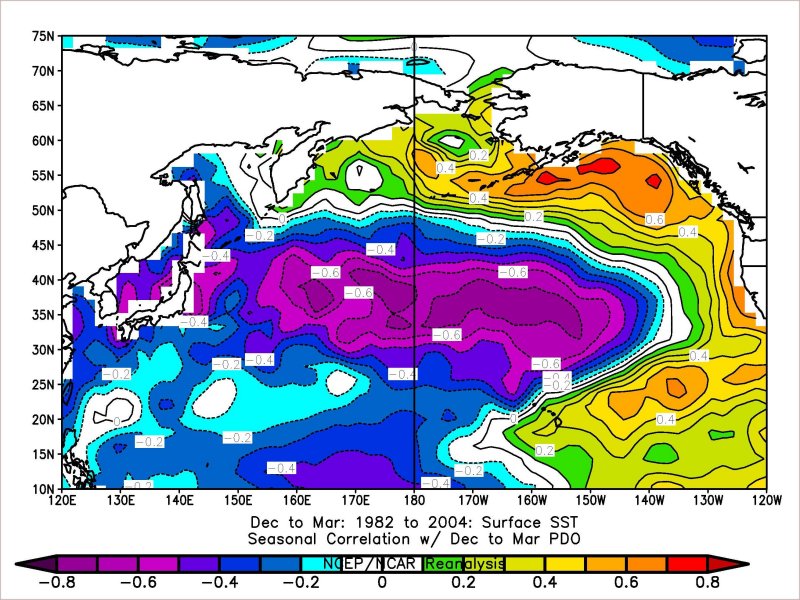
Fig. 4. The distribution of the correlation coefficients between a) the EP index and b) the PDO index and SST anomalies for the winter (DJFM) season, 1982-2004.
Starting with the winter of 1998, the sense of the EP became predominantly positive (Fig. 2b), i.e., the polarity of the north-south pressure dipole switched (Fig. 3b). As a whole, the period 1998-2004 was characterized by an increased cyclonic activity in the Bering Sea and anomalously strong Subtropical high. The only exception from this pattern was the El Niño winter of 2003 when the EP index was negative due to a strongly negative 500-hPa height anomaly in the east-central North Pacific. The SST response to these atmospheric changes, as it can be inferred from Fig. 3a, was a switch toward notably colder winters in the California Current region (Peterson and Schwing 2003) and a string of anomalously mild winters in the Bering Sea (Bond et al. 2003).
The 1998 regime shift exhibited itself strongly in spring-summer months as well, as evidenced by the EP index and North Pacific (NPCPC) indices for April-July (Figs. 2c and 2d, respectively). Positive values of the NPCPC index correspond to higher 500-hPa heights over the Bering Sea and lower heights for the region south of the Aleutian Islands. Therefore, during the period 1990-1997, the north-south pressure dipole was basin wide (Fig. 3c) and not limited to the eastern North Pacific as in winter (Fig. 3a). In spring-summer, the shift of 1998 was characterized not by a shift in the polarity of the north-south pressure dipole as in winter, but by a transition to a monopole with a high pressure center south of the Alaska Peninsular (Fig. 3d). This distribution of 500-hPa height anomalies is associated with a weak Aleutian low and a negative phase of the PDO.
In summary, the climate regime of positive PDO phase established in the late 1970s appears to have mostly continued, at least in the winter season. On the background of this multidecadal climate regime, there were two minor regime shifts on the decadal time scale. The first shift occurred in 1989 and the second one in 1998, the former being more prominent in winter, whereas the latter in spring-summer. The period 1977-1988 represents a classical positive PDO regime, with a stronger-than-normal Aleutian low and anomalously warm waters along the west coast of North America stretching as far north as the eastern Bering Sea. Variations in the North Pacific climate since 1989 have to do with the north-south pressure dipole in the atmosphere and the second principal SST mode in the ocean, rather than with the PDO phase. During the period 1989-1997, atmospheric pressure tended to be above normal in the high latitudes and below normal in the mid-latitudes, a pattern observed in both winter and spring-summer seasons. This resulted in a relative cooling in the Bering Sea, but no apparent changes in SST variations along the U.S. West Coast were reported. Since 1998, the polarity of the winter north-south pressure dipole reversed. The SST field responded in the way that positive SST anomalies dominated in the eastern Bering Sea, whereas negative SST anomalies were observed along the U.S. West Coast. During the spring-summer season, the 1998 shift exhibited itself in a transition from the north-south pressure dipole to a monopole characteristic of the negative PDO pattern. While there is no strong correlation between winter and summer PDO indices on the year-to-year scale, the two variables experienced similar regime shifts in the past. It is unclear whether the shift in the summer PDO index to significantly negative values from 1999 through 2001 represents just a temporary reprieve from positive PDO conditions, or heralds the onset of an extended period featuring negative PDO conditions throughout the year.
Climate in 2004
After the 2002-2003 El Niño event, El Niño-Southern Oscillation (ENSO) conditions in the equatorial Pacific Ocean remained near-neutral during the first six month of 2004. The Southern Oscillation Index (SOI) shows pronounced month-to-month variability with no persistent positive or negative trend (Fig. 5), which suggests a weakening of air-sea coupling in the equatorial Pacific. SST anomalies off the coast of South America (Nino 1+2 region) remain predominantly negative, while in the central equatorial Pacific (region 3.4, which is considered to be a better indicator of ENSO events) SST anomalies are positive (Fig. 6). Based on the latest observations and forecasts from the Climate Prediction Center, it is likely that weak El Nino conditions (with SST anomalies more prominent in the central tropical Pacific) will develop over the rest of 2004 and persist into early 2005.
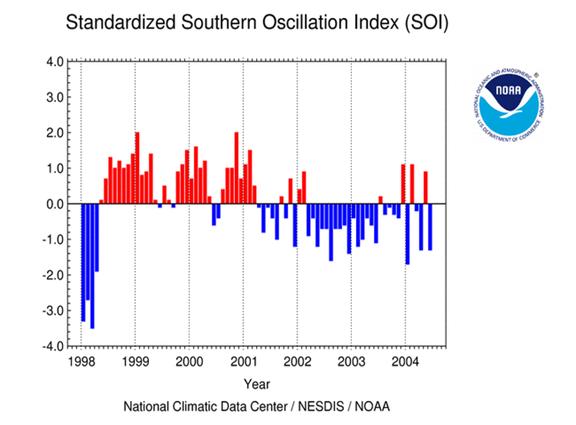 |
Fig. 5. Mean monthly values of the Southern Oscillation Index, January 1998 through June 2004. |
 |
Fig. 6. SST anomalies (deg. C) along the west coast of South America (Nino 1+2 region) and central parts of the equatorial belt (Nino 3, 3.4, and 4 regions). |
The mean winter (DJFM) Aleutian low was about 5 hPa deeper than its average value during the 1968-1996 base period. It was also shifted to the northwest of its normal position, a situation conducive to milder than normal winters in the Bering Sea (Rodionov at al. 2004). Cyclonic activity was somewhat enhanced in the Gulf of Alaska. The mean winter 500-hPa anomaly map (not shown) features a north-south dipole over the eastern North Pacific characteristic of positive phases of the EP and Victoria patterns. At the sea level, however, the north-south dipole is much less pronounced.
During the winter of 2004, the SST anomaly pattern in the North Pacific (Fig. 7) resembled neither the PDO, nor the Victoria patterns. Winter temperatures were above the 1971-2000 average in the Bering Sea and near the average in the Gulf of Alaska and the U.S. West Coast. The lack of any significant ENSO event in 2004 increases the uncertainty of what major SST pattern should be expected in the winter of 2005.
 |
Fig. 7. Mean seasonal SST anomalies in the winter (DJFM) of 2004. Anomalies are relative to the 1971-2000 base period. Source data: NOAA OI.v2 SST monthly fields. |
References
Bond, N.A., J.E. Overland, M. Spillane, and P. Stabeno, 2003: Recent shifts in the state of the North Pacific. Geophys. Res. Lett., 30, DOI 10.1029/2003GL018597.
Hare S.R., and N.J. Mantua, 2000: Empirical evidence for North Pacific regime shifts in 1977 and 1989. Progr. Oceanog., 47, 103-146.
Mantua, N.J. and S.R. Hare, Y. Zhang, J.M. Wallace, and R.C. Francis, 1997: A Pacific interdecadal climate oscillation with impacts on salmon production, Bull. Amer. Meteorol. Soc., 78, 1069-1079.
Minobe, S., 1999: Resonance in bidecadal and pentadecadal climate oscillations over the North Pacific: Role in climate regime shifts, Geophys. Res. Lett., 26, 853-858.
McFarlane, G. A., King, J. R., and Beamish, R. J., 2000: Have there been recent changes in climate: Ask the fish, Progr. Oceanog., 47, 147-169.
Niebauer, H.J., 1998: Variabillity in Bering Sea ice cover as affected by a regime shift in the Pacific in the period 1947-1996, J. Geophys. Res., 103, 27717-27737.
Overland, J.E., N. Bond, and M. Yang, 2004: Ocean and climate changes. In: North Pacific Ecosystem Status. PICES Press.
Peterson, W.T. and F.B. Schwing, 2003: A new climate regime in Northeast Pacific ecosystems, Geophys. Res. Lett., 30, doi:10.1029/2003GL017528.
Rodionov, S.N., 2004: A sequential algorithm for testing climate regime shifts. Geophys. Res. Lett., 31, doi:10.1029/2004GL019448.
Rodionov, S.N., J.E. Overland, and N.A. Bond, 2004: The Aleutian low and winter climatic conditions in the Bering Sea. Part I: Classification. J. Climate (in press).
Trenberth, K.E., and T.J. Hoar, 1995: The 1990-1995 El Nino-Southern Oscillation event: Longest in the record, Geophys. Res. Lett., 23, 57-60.