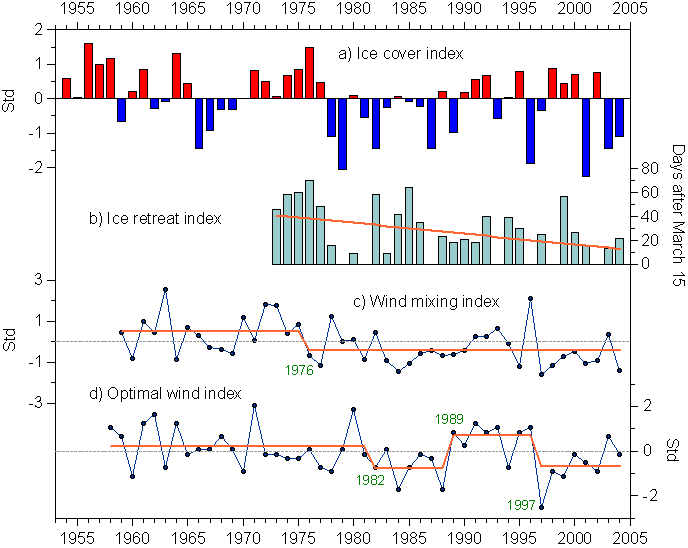

Fig. 2. a) Ice cover index, 1954-2004, b) ice retreat index and its linear trend (orange line), 1973-2004, c) wind mixing index (June-July) at Mooring 2, 1959-2004, and d) optimal wind index for successful larval feeding (1 May – 15 July), 1958-2004. The stepwise functions (orange lines) characterize regime shifts in the level of fluctuations of the variables. Shift points were calculated using the STARS method (Rodionov 2004), with the cutoff length of 7 years and significance level of 0.2.